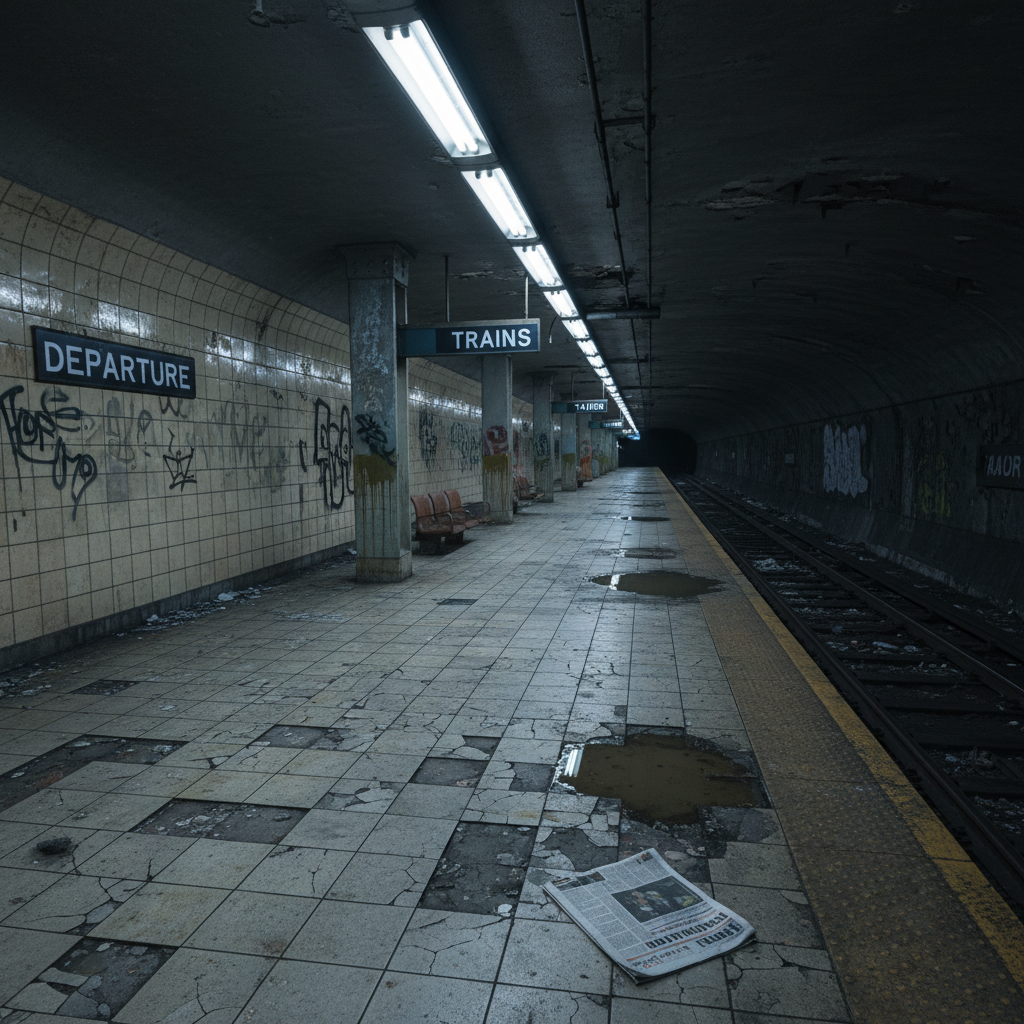
The same station.
Sixteen years apart.
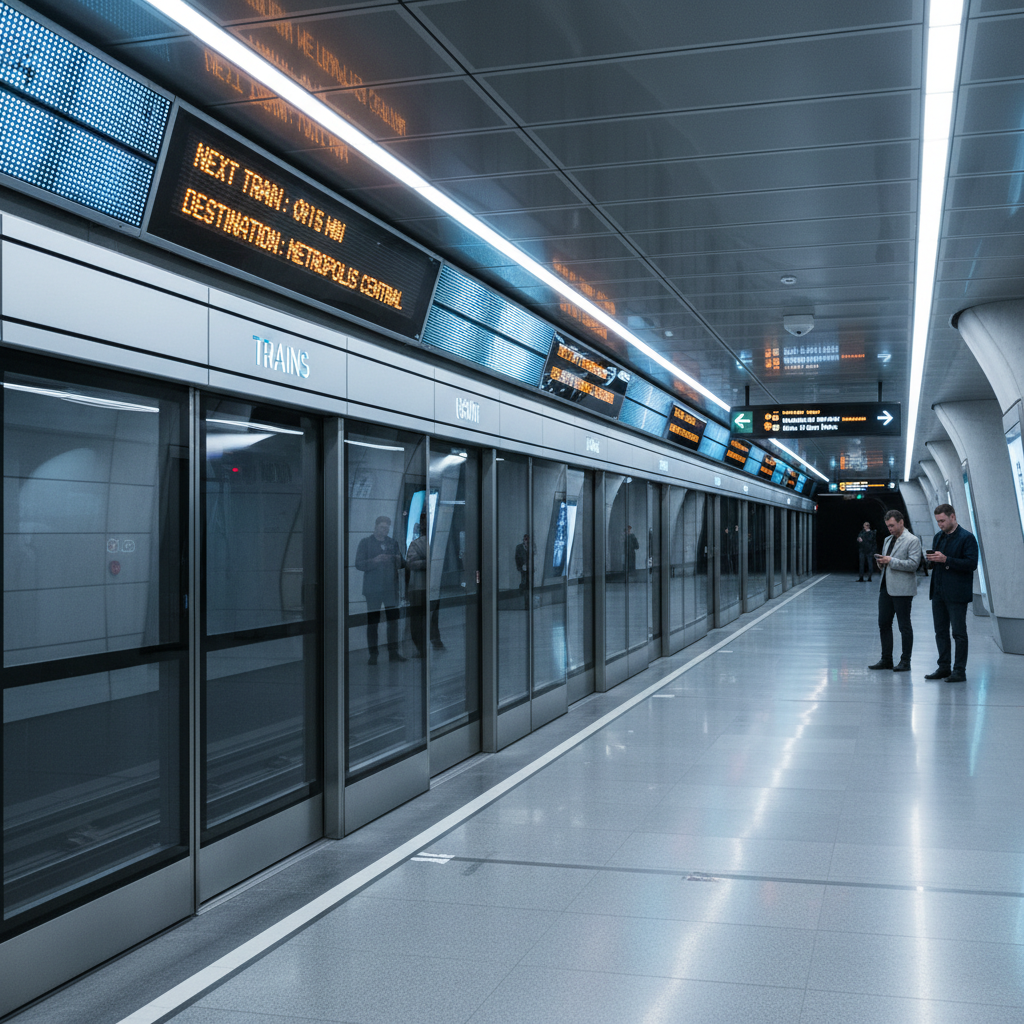
Drag the rail to compare what your network looked like in 2009 — and what it can look like when the next capital budget cycle closes.

Aging subway platform circa 2009 with fluorescent lighting, cracked tiles, and analog signage with missing letters
Modernized subway station with LED wayfinding, platform edge doors sealed shut, and real-time arrival boards glowing amber
2009 — Legacy
2026 — Modernized
← Drag Rail →
Review the Full Modernization Plan

4 million daily riders. One capital decision.

Scroll to quantify
Active Lines14
Stations Equipped187
Daily Riders4.1M
Signal Uptime99.7%
Avg Headway90s
Energy Recovered31%
Fleet Modernized68%
PSD Installations94
Dwell Reduction−42%
On-Time Performance96.2%
Active Lines14
Stations Equipped187
Daily Riders4.1M
Signal Uptime99.7%
Avg Headway90s
Energy Recovered31%
Fleet Modernized68%
PSD Installations94
Dwell Reduction−42%
On-Time Performance96.2%

Headway is the
measure of capacity.

Fixed-block signaling from the 1980s caps your throughput regardless of fleet investment. Communications-Based Train Control removes the ceiling — trains follow each other by position, not fixed territory.

Legacy Headway
0sec
Fixed-block ATCS
CBTC Headway
120sec
+25% throughput gain
Signaling Performance Comparison
Train Separation25%
Legacy120sec
Modernized90sec
Throughput Capacity+67%
Legacy24tph
Modernized40tph
Signal Fault Rate90%
Legacy4.2/mo
Modernized0.4/mo
Recovery Time78%
Legacy18min
Modernized4min

CBTC deployment on 6 core lines recovers 14 train-minutes of capacity per peak hour — equivalent to running 2 additional trainsets without purchasing new rolling stock.

38 seconds becomes
22 seconds.

Wide-aisle rolling stock with four-wide door clusters and predictive door-hold logic. Each second recovered at 187 stations compounds into network-level throughput.

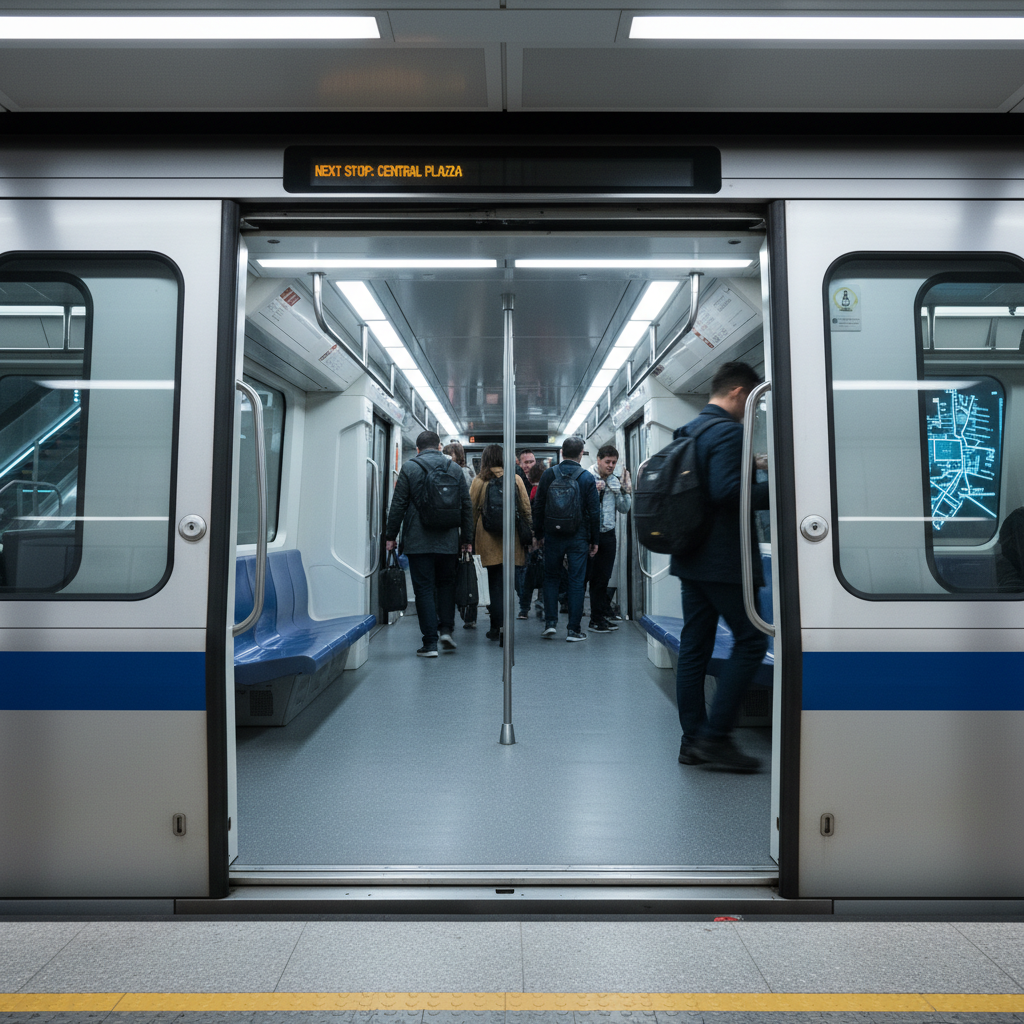
Modern metro train with wide doors and LED interior lighting showing passenger boarding efficiency
Door Cycle Comparison
Legacy stock
0sec
New fleet
38sec
Dwell Time by Station Category (seconds)
Interchange Hub
42s legacy26s CBTC
Terminal Station
38s legacy22s CBTC
Peak Express Stop
35s legacy20s CBTC
Off-Peak Local
28s legacy18s CBTC
Door Events/Day
0
Fleet Utilization
0%
Boarding Efficiency
+38%

Every brake event
generates revenue.

Regenerative braking on modern rolling stock returns traction power back to the third rail. At 4.1 million daily trips, the compounding effect makes energy recovery a capital budget line item, not a sustainability footnote.

Annual Energy Cost Reduction
vs. legacy fleet baseline
$0M
Peak Demand Reduction
during morning inbound surge
0%
CO₂ Reduction
per annum, full fleet conversion
0t
Regenerative Energy Return (% of traction power)
0%
Legacy Fleet
Resistor braking
0%
Modern Fleet
Regenerative + supercap
Recovery Improvement
+0%
from 9% → 31% return on traction energy

The edge of the platform
is now a sealed system.

Platform screen doors eliminate track intrusion, reduce HVAC load by 18%, and allow dwell-time optimization by removing the human margin from door-hold decisions.

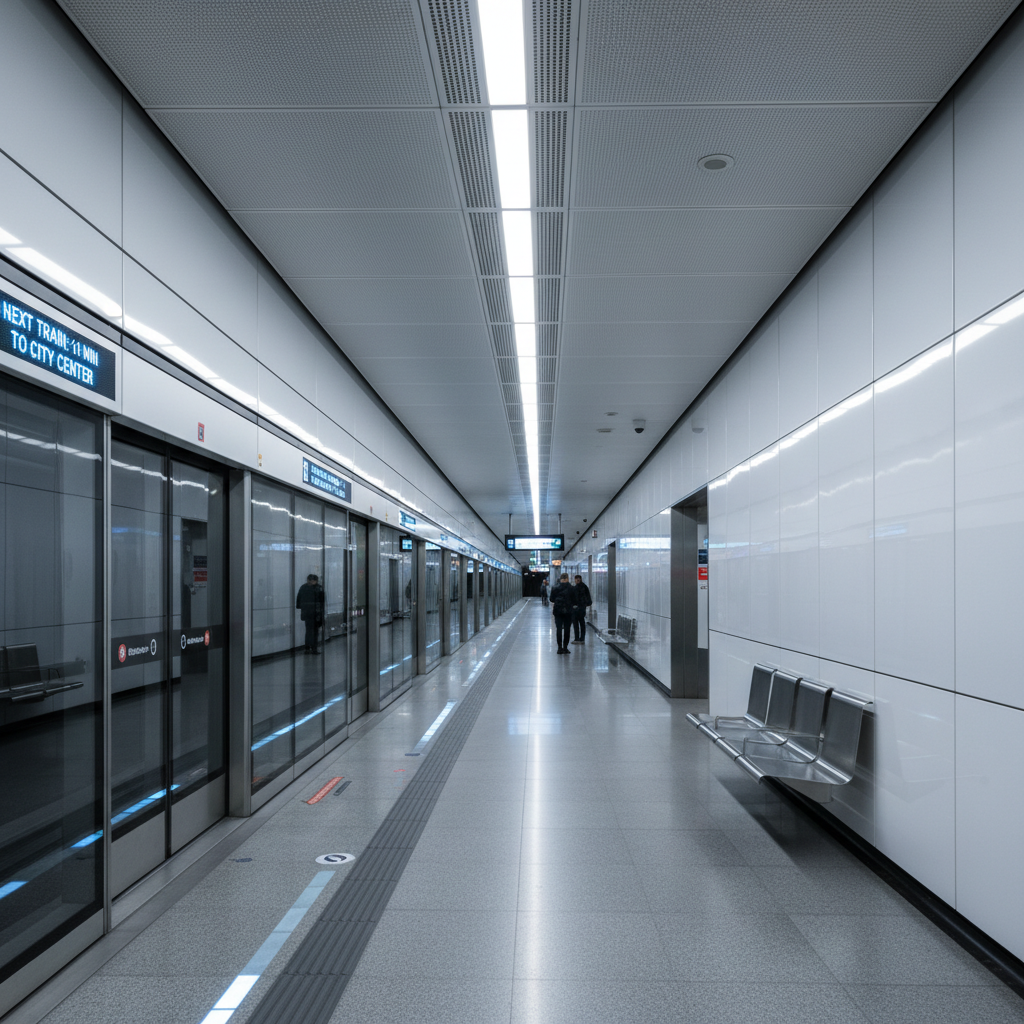
Modern subway station platform with platform screen doors sealed shut and LED wayfinding panels showing real-time arrivals
Track Intrusion Events
847post-PSD
847 incidents pre-installation
HVAC Load Reduction
0%
platform climate separation
Active Lines
0
CBTC-ready corridors
PSD Stations
0
Platform screen doors installed
Traction Uptime
0%
Third-rail availability YTD
Fleet Modernized
0%
412 of 608 cars retired
On-Time Performance
0%
Peak hour, all lines
Safety Incidents
0
PSD-related, 18-month period
Capital Planning Document

The cost of inaction
compounds every quarter.

The full modernization plan covers signaling architecture, fleet procurement timelines, energy ROI models, and PSD installation sequencing — structured for council presentation and procurement committee review.

Transit Modernization Program — 4 system dimensions. One capital decision.